
Getting Started#
Opening files#
The first step is to load in some tracks. HuracanPy can load track data from various sources as an xarray.Dataset with a minimal number of assumed variables (track_id, lon, lat, time) e.g.
[1]:
import huracanpy

tracks = huracanpy.load(huracanpy.example_csv_file)
print(tracks)
<xarray.Dataset> Size: 7kB
Dimensions:   (record: 99)
Dimensions without coordinates: record
Data variables:
    track_id  (record) int64 792B 0 0 0 0 0 0 0 0 0 0 0 ... 2 2 2 2 2 2 2 2 2 2
    i         (record) int64 792B 482 476 476 477 478 ... 229 230 234 241 249
    j         (record) int64 792B 417 419 420 420 422 ... 501 509 517 528 542
    lon       (record) float64 792B 120.5 119.0 119.0 119.2 ... 58.5 60.25 62.25
    lat       (record) float64 792B -14.25 -14.75 -15.0 ... -39.25 -42.0 -45.5
    slp       (record) float64 792B 9.988e+04 9.981e+04 ... 9.747e+04 9.754e+04
    zs        (record) float64 792B -10.71 -16.11 -40.21 ... -218.5 -211.5
    wind10    (record) float64 792B 14.65 13.99 13.7 17.98 ... 23.69 23.96 23.4
    time      (record) datetime64[ns] 792B 1980-01-06T06:00:00 ... 1980-01-30...
Each “record” corresponds to a TC point (time, lon, lat).
Note that the data is one dimensional but represents multiple tracks. This is done rather than having track_id as an additional dimension to avoid having to add blank data to each track when they are not the same length. The groupby function, built in to xarray, allows us to easily loop over tracks in this format.
[2]:
# Iterating over all tracks
# Each track will be a subset of the xarray Dataset with a unique track_id
# The track_id is not necessarily an integer, it follows whatever you have loaded
# e.g. could be a string for IBTrACS
for track_id, track in tracks.groupby("track_id"):
    # Do something with the track
    print(track_id, len(track.time))
0 31
1 20
2 48
With the data loaded, we can apply the functions from HuracanPy. The example below is using the hrcn accessor from HuracanPy. See the accessor page for more details.
[3]:
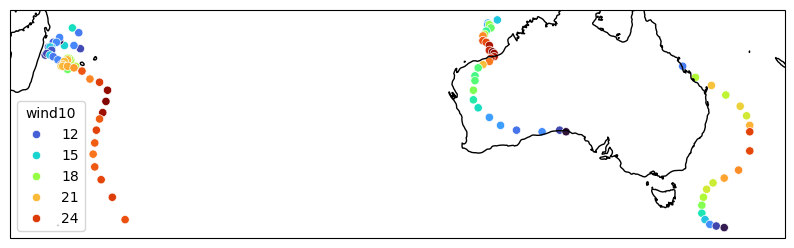
# Quickly view the tracks
tracks.hrcn.plot_tracks(intensity_var_name="wind10")
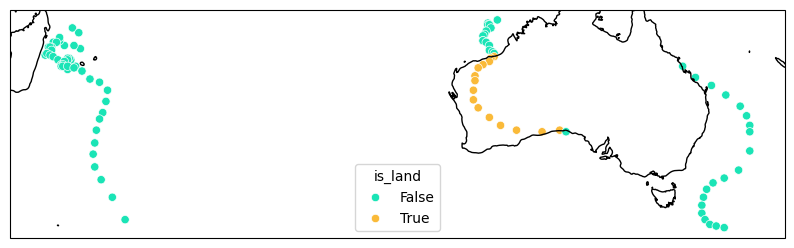
# Add a new variable to the tracks and plot this instead
tracks = tracks.hrcn.add_is_land()
tracks.hrcn.plot_tracks(intensity_var_name="is_land")
[3]:
(<Figure size 1000x1000 with 1 Axes>, <GeoAxes: xlabel='lon', ylabel='lat'>)
For more in-depth examples see example workflows or the examples gallery. Or check the API to see everything included with HuracanPy.