Fancy line plots#
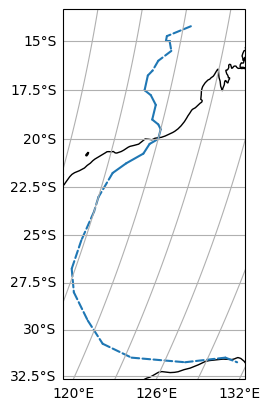
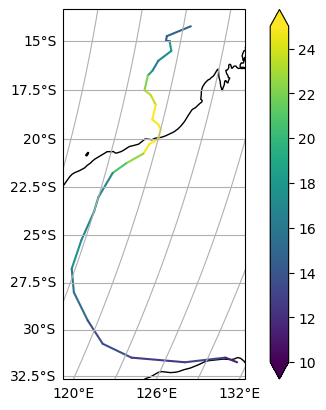
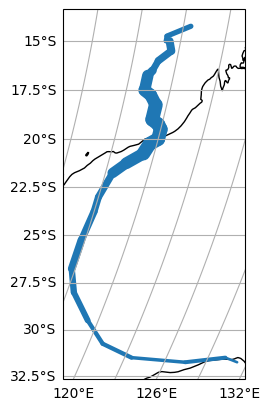
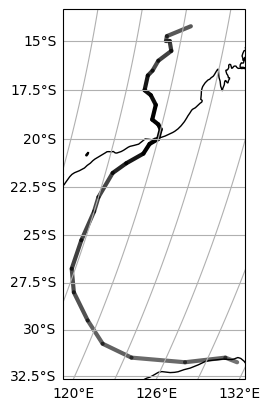
huracanpy.plot.fancyline allows you to plot a line with variable attributes (color, linewidth, transparency, linestyle). This is useful for showing a track and an attribute of that track on the same map. Below is an example of setting each of these variables using the track wind speed. The different options can also be combined
[1]:
import matplotlib.pyplot as plt
from cartopy.crs import EqualEarth

import huracanpy
from huracanpy.plot import fancyline

# Load in a single track from example data
tracks = huracanpy.load(huracanpy.example_csv_file)
track = tracks.groupby("track_id")[0]
[2]:
# Set up a figure with a cartopy projection
ax = plt.axes(projection=EqualEarth())

# Show 10m wind speed with a colourscale
lc = fancyline(
    track.lon,
    track.lat,
    track.wind10,
    vmin=10,
    vmax=25,
    ax=ax,
)

plt.colorbar(lc, extend="both")
ax.coastlines()
ax.gridlines(draw_labels=["left", "bottom"])

plt.show()
/home/docs/checkouts/readthedocs.org/user_builds/huracanpy/envs/latest/lib/python3.14/site-packages/cartopy/io/__init__.py:242: DownloadWarning: Downloading: https://naturalearth.s3.amazonaws.com/50m_physical/ne_50m_coastline.zip
  warnings.warn(f'Downloading: {url}', DownloadWarning)
[3]:
# Set up a figure with a cartopy projection
ax = plt.axes(projection=EqualEarth())

# Show 10m wind speed with linewidth
fancyline(
    track.lon,
    track.lat,
    linewidths=track.wind10,
    wmin=10,
    wmax=25,
    wrange=(1, 10),
)
ax.coastlines()
ax.gridlines(draw_labels=["left", "bottom"])

plt.show()
[4]:
# Show 10m wind speed with alpha (transparency)
# Example with other arguments as single values for all lines

# Set up a figure with a cartopy projection
ax = plt.axes(projection=EqualEarth())

fancyline(
    track.lon,
    track.lat,
    alphas=track.wind10,
    amin=10,
    amax=25,
    arange=(0.5, 1),
    colors="k",
    linewidths=3,
    ax=ax,
)
ax.coastlines()
ax.gridlines(draw_labels=["left", "bottom"])

plt.show()
[5]:
# Use the linestyle as categorical whether 10m wind is greater than a threshold
linestyles = ["--" if x < 20 else "-" for x in track.wind10]

ax = plt.axes(projection=EqualEarth())
fancyline(track.lon, track.lat, linestyles=linestyles, ax=ax)
ax.coastlines()
ax.gridlines(draw_labels=["left", "bottom"])

plt.show()