[1]:
import huracanpy
Embedded IBTrACS Subsets#
IBTrACS can be loaded in two ways using HuracanPy’s load function:
Online: You can load the latest version of any IBTrACS subset using the load function, provided you are connected to internet
Offline: Your installation of huracanpy embeds parts of the IBTrACS database which can be loaded even if you are not connected to internet.
Two offline subsets are currently available:
“wmo” contains the data provided in the “wmo” columns, which correspond to the data provided by the center responsible for the area of a given point. (see https://community.wmo.int/en/tropical-cyclone-regional-bodies) Note that within this dataset, wind units are not homogeneous: they are provided as collected from the meteorological agencies, which means that they have different time-averaging for wind extrema. (default)
“usa” contains the data provided in the “wmo” columns, which is provided by the NHC or the JTWC.
Loading these will raise a warning to remind you that these datasets are offline versions with caveats and some post-treatment.
[2]:
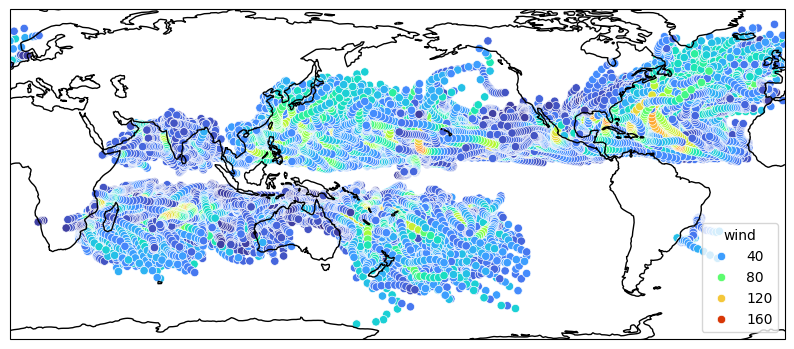
# WMO subset
ib_wmo = huracanpy.load(source="ibtracs", ibtracs_online=False, ibtracs_subset="wmo")
huracanpy.plot.tracks(ib_wmo.lon, ib_wmo.lat, intensity_var=ib_wmo.wind)
/home/docs/checkouts/readthedocs.org/user_builds/huracanpy/envs/stable/lib/python3.12/site-packages/huracanpy/_data/ibtracs.py:119: UserWarning: This offline function loads a light version of IBTrACS which is embedded within the package, based on a file produced manually by the developers.
 It was last updated on the 15th Nov 2024, based on the IBTrACS file at that date.
 It contains only data from 1980 up to the last year with no provisional tracks. All spur tracks were removed. Only 6-hourly time steps were kept.
  warnings.warn(
/home/docs/checkouts/readthedocs.org/user_builds/huracanpy/envs/stable/lib/python3.12/site-packages/huracanpy/_data/ibtracs.py:128: UserWarning: You are loading the IBTrACS-WMO subset. This dataset contains the positions and intensity reported by the WMO agency responsible for each basin
 Be aware of the fact that wind and pressure data is provided as they are in IBTrACS, which means in particular that wind speeds are in knots and averaged over different time periods.
 For more information, see the IBTrACS column documentation at https://www.ncei.noaa.gov/sites/default/files/2021-07/IBTrACS_v04_column_documentation.pdf
  warnings.warn(
[2]:
(<Figure size 1000x1000 with 1 Axes>, <GeoAxes: xlabel='lon', ylabel='lat'>)
[3]:
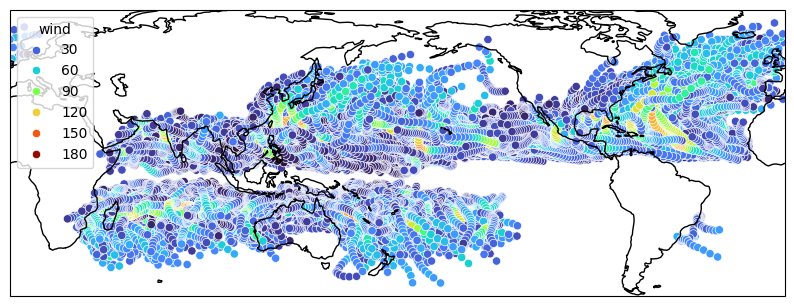
# USA subset
ib_usa = huracanpy.load(source="ibtracs", ibtracs_online=False, ibtracs_subset="usa")
huracanpy.plot.tracks(ib_usa.lon, ib_usa.lat, intensity_var=ib_usa.wind)
/home/docs/checkouts/readthedocs.org/user_builds/huracanpy/envs/stable/lib/python3.12/site-packages/huracanpy/_data/ibtracs.py:119: UserWarning: This offline function loads a light version of IBTrACS which is embedded within the package, based on a file produced manually by the developers.
 It was last updated on the 15th Nov 2024, based on the IBTrACS file at that date.
 It contains only data from 1980 up to the last year with no provisional tracks. All spur tracks were removed. Only 6-hourly time steps were kept.
  warnings.warn(
[3]:
(<Figure size 1000x1000 with 1 Axes>, <GeoAxes: xlabel='lon', ylabel='lat'>)
Both subsets currently cover the 1980-2022. The WMO subset contains more tracks, because the JTWC columns does not always contain data for all tracks
[4]:
print("WMO")
print(ib_wmo.time.values.min(), ib_wmo.time.values.max())
print(ib_wmo.track_id.hrcn.nunique(), "tracks", len(ib_wmo.record), "points\n")

print("JTWC")
print(ib_usa.time.values.min(), ib_usa.time.values.max())
print(ib_usa.track_id.hrcn.nunique(), "tracks", len(ib_usa.record), "points")
WMO
1980-01-01T00:00:00 2022-12-25T06:00:00
4540 tracks 143287 points

JTWC
1980-01-01T00:00:00 2022-12-19T00:00:00
4170 tracks 121806 points
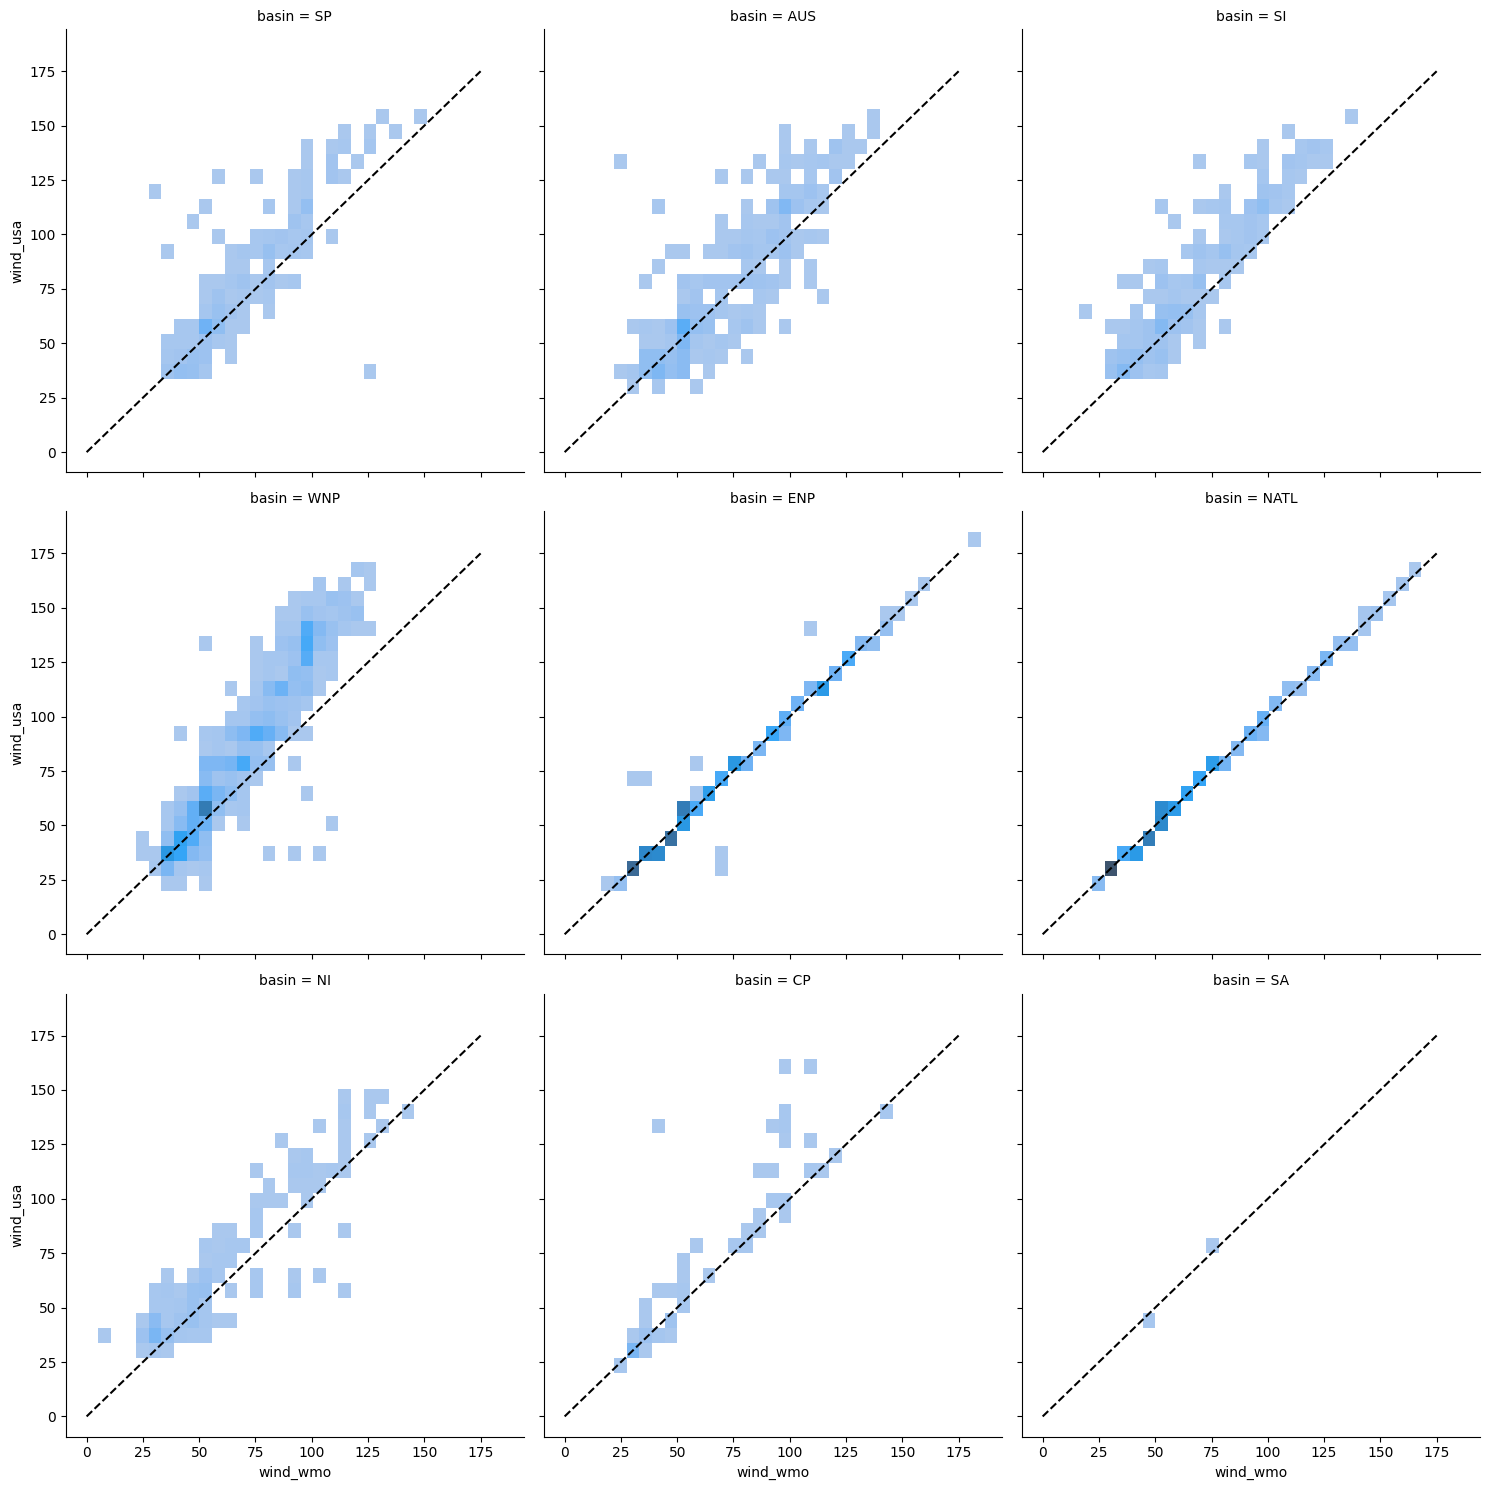
One of the main differences among these two subsets is the way winds are reported: In WMO, the maximum winds as reported by the WMO agencies are provided. This is inhomogeneous: the USA report 1-minute sustained winds, CMA reports 3-minutes sustained winds, and most other centers report 10-minutes sustained winds.
[5]:
# Add basin data to ib_wmo
ib_wmo = ib_wmo.hrcn.add_basin()
# Match tracks between ib_wmo and ib_usa, then retrieve LMI
m = huracanpy.assess.match([ib_wmo, ib_usa], names=["wmo", "usa"])
max_winds = m.join(
    ib_wmo[["wind"]].groupby(ib_wmo.track_id).max().to_dataframe(), on="id_wmo"
).join(
    ib_usa[["wind"]].groupby(ib_usa.track_id).max().to_dataframe(),
    on="id_usa",
    lsuffix="_wmo",
    rsuffix="_usa",
)
[6]:
# Add basin with separate groupby
max_winds = max_winds.join(
    ib_wmo[["basin"]].groupby(ib_wmo.track_id).first().to_dataframe(), on="id_wmo"
)
[7]:
# Plot difference between WMO and USA winds in each basin
import seaborn as sns

p = sns.displot(
    data=max_winds,
    x="wind_wmo",
    y="wind_usa",
    col="basin",
    col_wrap=3,
)
for ax in p.axes.flatten():
    ax.plot([0, 175], [0, 175], color="k", linestyle="--")