Beta drift#
[1]:
import huracanpy

import matplotlib.pyplot as plt
[2]:
data = huracanpy.load(huracanpy.example_TRACK_file, source="TRACK")
[3]:
# 1. Compute Radius of Maximum Wind
# Distance between the vortex centre and the location of the maximum wind speed
# identified by TRACK (feature_9)
RMW = huracanpy.calc.distance(
    data.lon, data.lat, data.feature_9_lon, data.feature_9_lat
)
data = data.assign(RMW=RMW)
[4]:
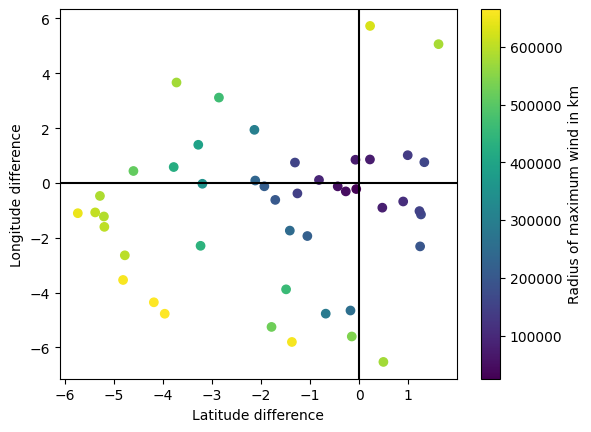
# Verify result
plt.scatter(data.lat - data.feature_9_lat, data.lon - data.feature_9_lon, c=RMW)
plt.colorbar(label="Radius of maximum wind in km")
plt.xlabel("Latitude difference")
plt.ylabel("Longitude difference")
plt.axhline(color="k")
plt.axvline(color="k")
[4]:
<matplotlib.lines.Line2D at 0x7f679e2d6660>
[5]:
# 2. Compute beta-drift
V_drift, theta_drift = huracanpy.tc.beta_drift(data.lat, data.feature_9, data.RMW)
data = data.assign(V_drift=V_drift, theta_drift=theta_drift)
[6]:
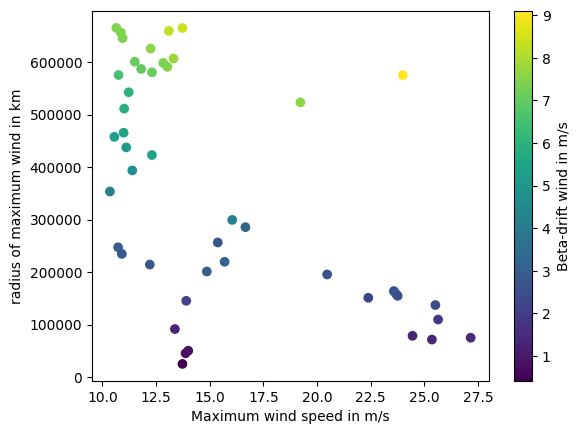
# Verify result
plt.scatter(
    data.feature_9,
    data.RMW,
    c=data.V_drift,
)
plt.colorbar(label="Beta-drift wind in m/s")
plt.xlabel("Maximum wind speed in m/s")
plt.ylabel("radius of maximum wind in km")
[6]:
Text(0, 0.5, 'radius of maximum wind in km')
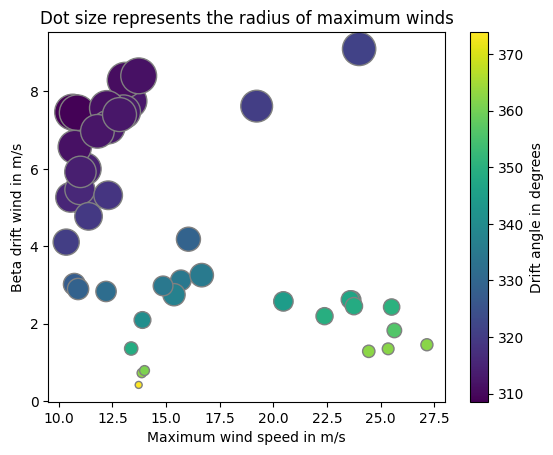
[7]:
plt.scatter(
    data.feature_9,
    data.V_drift,
    c=data.theta_drift,
    s=data.RMW / 1e3,
    edgecolors="grey",
)
plt.colorbar(label="Drift angle in degrees")
plt.xlabel("Maximum wind speed in m/s")
plt.ylabel("Beta drift wind in m/s")
plt.title("Dot size represents the radius of maximum winds")
[7]:
Text(0.5, 1.0, 'Dot size represents the radius of maximum winds')