[1]:
from cartopy.crs import EqualEarth, Geodetic
import huracanpy
import matplotlib.pyplot as plt
Cyclone stalling#
Corral radius#
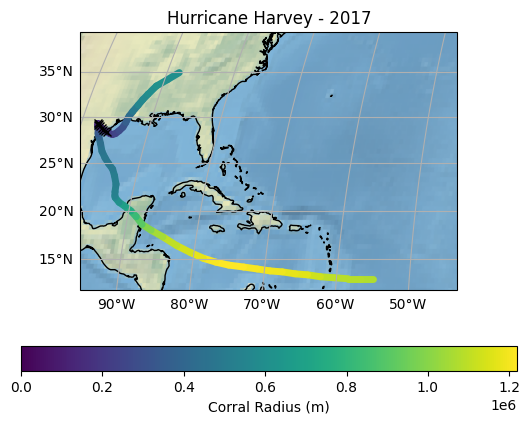
Trepanier et al. (2024) defined a stalled cyclone as one that had a 72-hour corral radius of less than 200km. The corral radius is defined as the smallest radius circle that contains all of the track points within the given window. This can be calculated with huracanpy.calc.corral_radius
Below is an example of calculating the corral radius and stalled points for Hurricane Harvey in 2017, an infamously slow moving tropical cyclone that produced extreme rainfall totals.
[2]:
tracks = huracanpy.load(source="ibtracs")
harvey = tracks.hrcn.sel_id("2017228N14314")
/home/docs/checkouts/readthedocs.org/user_builds/huracanpy/envs/stable/lib/python3.12/site-packages/huracanpy/_data/ibtracs.py:119: UserWarning: This offline function loads a light version of IBTrACS which is embedded within the package, based on a file produced manually by the developers.
 It was last updated on the 15th Nov 2024, based on the IBTrACS file at that date.
 It contains only data from 1980 up to the last year with no provisional tracks. All spur tracks were removed. Only 6-hourly time steps were kept.
  warnings.warn(
/home/docs/checkouts/readthedocs.org/user_builds/huracanpy/envs/stable/lib/python3.12/site-packages/huracanpy/_data/ibtracs.py:128: UserWarning: You are loading the IBTrACS-WMO subset. This dataset contains the positions and intensity reported by the WMO agency responsible for each basin
 Be aware of the fact that wind and pressure data is provided as they are in IBTrACS, which means in particular that wind speeds are in knots and averaged over different time periods.
 For more information, see the IBTrACS column documentation at https://www.ncei.noaa.gov/sites/default/files/2021-07/IBTrACS_v04_column_documentation.pdf
  warnings.warn(
[3]:
# The window is taken backward and forward from the centre point, so 36 gives a 72-hour
# window
corral_radius = harvey.hrcn.get_corral_radius(window=36)

# Stalled points are where the corral radius is less that 200km
# note that units are in metres
stalled_points = corral_radius < 200e3
[4]:
ax = plt.axes(projection=EqualEarth())
im = huracanpy.plot.fancyline(
    harvey.lon, harvey.lat, colors=corral_radius, vmin=0, linewidths=5
)
plt.plot(
    harvey.lon[stalled_points], harvey.lat[stalled_points], "xk", transform=Geodetic()
)
plt.colorbar(im, label="Corral Radius (m)", orientation="horizontal")

ax.stock_img()
ax.coastlines()
ax.gridlines(draw_labels=["left", "bottom"])
ax.set_title("Hurricane Harvey - 2017")
[4]:
Text(0.5, 1.0, 'Hurricane Harvey - 2017')