
Basins#
[1]:
from shapely import MultiPolygon
import matplotlib.pyplot as plt

import huracanpy
[2]:
# Basins defined in huracanpy
huracanpy.basins.keys()
[2]:
dict_keys(['WMO-TC', 'ibtracs', 'Sainsbury2022JCLI', 'Sainsbury2022MWR', 'Knutson2020'])
[3]:
# Example of one convention
huracanpy.basins["WMO-TC"]
[3]:
| geometry | |
|---|---|
| SI | POLYGON ((20 -90, 20 0, 90 0, 90 -90, 20 -90)) |
| AUS | POLYGON ((90 -90, 90 0, 160 0, 160 -90, 90 -90)) |
| SP | MULTIPOLYGON (((160 0, 160 -90, 180 -90, 180 0... |
| SA | POLYGON ((-65 -90, -65 0, 20 0, 20 -90, -65 -90)) |
| NATL | POLYGON ((-100 90, 0 90, 0 0, -65 0, -100 20, ... |
| ENP | POLYGON ((-140 90, -100 90, -100 20, -65 0, -1... |
| CP | POLYGON ((-180 0, -180 90, -140 90, -140 0, -1... |
| WNP | POLYGON ((100 0, 100 90, 180 90, 180 0, 100 0)) |
| NI | POLYGON ((30 0, 30 90, 100 90, 100 0, 30 0)) |
| MED | POLYGON ((0 0, 0 90, 30 90, 30 0, 0 0)) |
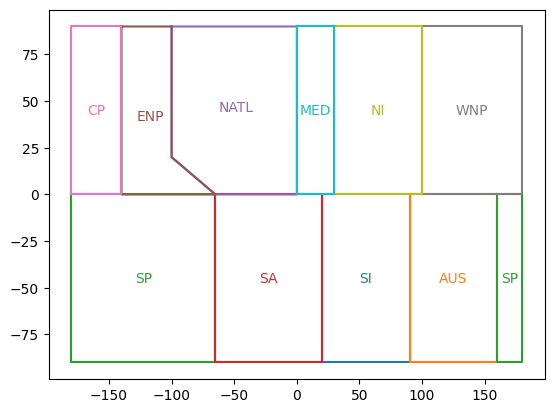
[4]:
# Plot WMO convention
# Default defined from 0-360.
for n, (basin, geometry) in enumerate(huracanpy.basins["WMO-TC"].iterrows()):
    # South Atlantic (SA) crosses dateline so is defined as two regions
    if isinstance(geometry.geometry, MultiPolygon):
        for geom in geometry.geometry.geoms:
            x, y = geom.exterior.xy
            plt.plot(x, y, color=f"C{n}")
            x, y = geom.centroid.xy
            plt.text(x[0], y[0], basin, color=f"C{n}", ha="center", va="center")
    else:
        plt.plot(*geometry.geometry.exterior.xy, color=f"C{n}")
        x, y = geometry.geometry.centroid.xy
        plt.text(x[0], y[0], basin, color=f"C{n}", ha="center", va="center")
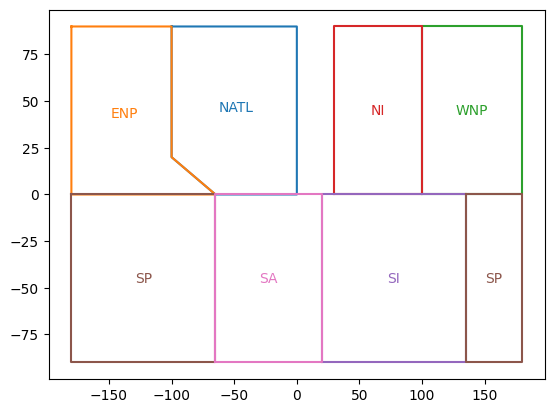
[5]:
# Plot Knutson convention
# Default defined from 0-360.
for n, (basin, geometry) in enumerate(huracanpy.basins["Knutson2020"].iterrows()):
    # South Atlantic (SA) crosses dateline so is defined as two regions
    if isinstance(geometry.geometry, MultiPolygon):
        for geom in geometry.geometry.geoms:
            x, y = geom.exterior.xy
            plt.plot(x, y, color=f"C{n}")
            x, y = geom.centroid.xy
            plt.text(x[0], y[0], basin, color=f"C{n}", ha="center", va="center")
    else:
        plt.plot(*geometry.geometry.exterior.xy, color=f"C{n}")
        x, y = geometry.geometry.centroid.xy
        plt.text(x[0], y[0], basin, color=f"C{n}", ha="center", va="center")
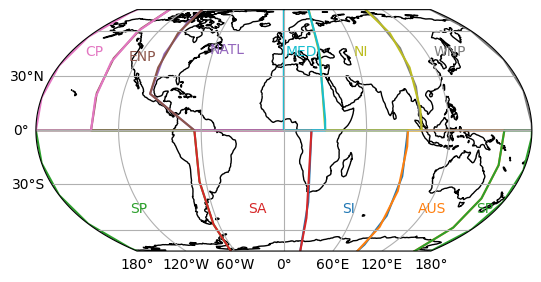
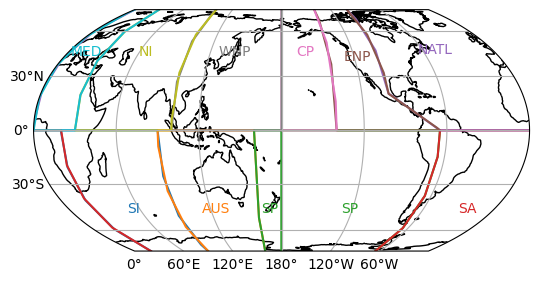
[6]:
# Plot basins with Cartopy projections
# Essentially the same as the previous panel

from cartopy.crs import EqualEarth, Geodetic

transform = Geodetic()

for central_longitude in [0, 180]:
    plt.figure()
    ax = plt.axes(projection=EqualEarth(central_longitude=central_longitude))

    for n, (basin, geometry) in enumerate(huracanpy.basins["WMO-TC"].iterrows()):
        if isinstance(geometry.geometry, MultiPolygon):
            for geom in geometry.geometry.geoms:
                plt.plot(*geom.exterior.xy, color=f"C{n}", transform=transform)
                x, y = geom.centroid.xy
                plt.text(
                    x[0],
                    y[0],
                    basin,
                    color=f"C{n}",
                    ha="center",
                    va="center",
                    transform=transform,
                )
        else:
            plt.plot(*geometry.geometry.exterior.xy, color=f"C{n}", transform=transform)
            x, y = geometry.geometry.centroid.xy
            plt.text(
                x[0],
                y[0],
                basin,
                color=f"C{n}",
                ha="center",
                va="center",
                transform=transform,
            )

    ax.coastlines()
    ax.gridlines(draw_labels=["left", "bottom"])
[ ]: