Pressure-Wind Relation#
In this notebook we show three examples of plotting using huracanpy.plot.pressure_wind_relation. The first two plots use the JTWC version of IBTrACS in huracanpy because it has more consistent definitions of winds
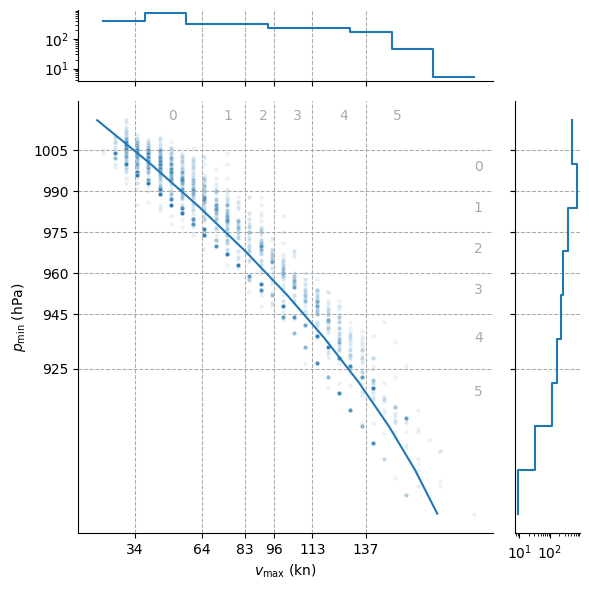
The first figure shows a plot of maximum intensity for all the TCs in the JTWC dataset
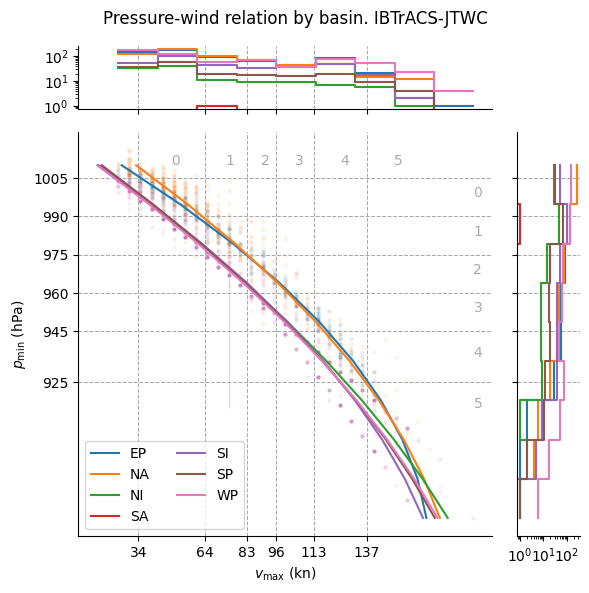
The second figure plots separate colors for each basin. This shows the consistency of North Atlantic and East Pacific basins, in which JTWC define wind speeds a 1-minute sustained winds, whereas other basins use longer time periods
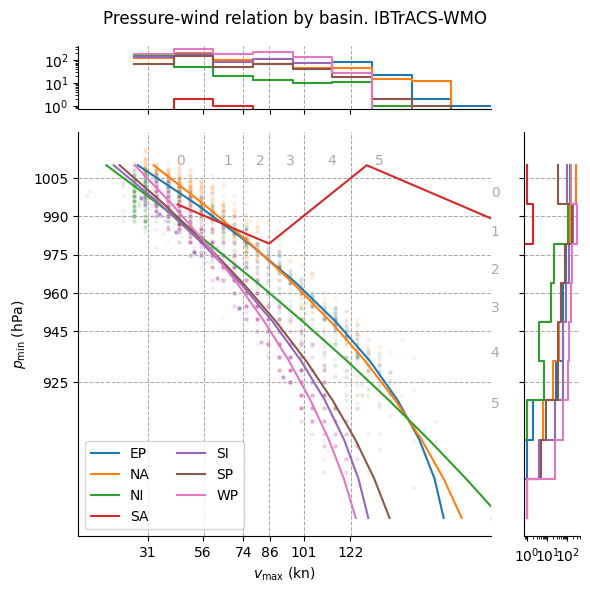
The third figure is a repeat of the second figure, but using the WMO version of IBTrACS. In this case the wind definitions are different for each basin and we see less consistent pressure-wind relations across basins
[1]:
import huracanpy
import matplotlib.pyplot as plt
import numpy as np
[2]:
# Use JTWC for more consistent definitions of wind speed
tracks = huracanpy.load(source="ibtracs", ibtracs_subset="jtwc")
/home/docs/checkouts/readthedocs.org/user_builds/huracanpy/envs/v1.4.0/lib/python3.12/site-packages/huracanpy/_data/ibtracs.py:119: UserWarning: This offline function loads a light version of IBTrACS which is embedded within the package, based on a file produced manually by the developers.
 It was last updated on the 15th Nov 2024, based on the IBTrACS file at that date.
 It contains only data from 1980 up to the last year with no provisional tracks. All spur tracks were removed. Only 6-hourly time steps were kept.
  warnings.warn(
[3]:
# Find each track at maximum intensity as a tropical cyclone
# Subset to tropical part of tracks without nans in pressure and wind
tracks = tracks.isel(
    record=np.where(
        np.isin(tracks.status, ["TD", "TS", "TY", "ST", "HU", "HR"])
        & ~np.isnan(tracks.slp)
        & ~np.isnan(tracks.wind)
    )[0]
)

# Get maximum intensity (by wind)
tracks_mi = tracks.hrcn.get_apex_vals("wind")
Single plot#
Note that we are setting wind_units="knots" and wind_convention="1min" to match the data in the IBTrACS JTWC subset
[4]:
huracanpy.plot.pressure_wind_relation(
    tracks_mi.slp, tracks_mi.wind, wind_units="knots", wind_convention="1min"
)
[4]:
(<seaborn.axisgrid.JointGrid at 0x764a8c1cce00>,
 <Quantity([ 872.  888.  904.  920.  936.  952.  968.  984. 1000. 1016.], 'hectopascal')>,
 <Quantity([ 20.          38.33333333  56.66666667  75.          93.33333333
  111.66666667 130.         148.33333333 166.66666667 185.        ], 'knot')>)
Overlaying Multiple Plots#
The pressure_wind_relation function returns the grid (generated by :py:class:seaborn.JointGrid) and the bins used for pressure and wind. To overlay more data onto the same figure pass the grid back to pressure_wind_relation. The example below also passes the bins back so that the histograms use the same binning.
[5]:
grid, bins_pressure, bins_wind = None, None, None
for basin, _tracks in tracks_mi.groupby("basin"):
    try:
        grid, bins_pressure, bins_wind = huracanpy.plot.pressure_wind_relation(
            _tracks.slp,
            _tracks.wind,
            wind_units="knots",
            wind_convention="1min",
            bins_pressure=bins_pressure,
            bins_wind=bins_wind,
            grid=grid,
            label=basin,
        )
    except np.linalg.LinAlgError:
        print(f"Basin {basin} quadratic fit not possible")

grid.ax_joint.legend(ncol=2)
grid.fig.suptitle("Pressure-wind relation by basin. IBTrACS-JTWC")
plt.tight_layout()
/home/docs/checkouts/readthedocs.org/user_builds/huracanpy/envs/v1.4.0/lib/python3.12/site-packages/numpy/polynomial/polynomial.py:1445: RankWarning: The fit may be poorly conditioned
  return pu._fit(polyvander, x, y, deg, rcond, full, w)
Using the IBTrACS WMO subset#
Here we still set wind_units="knots", but set wind_convention="10min". This is the default for the wind convention. The WMO subset has a mix of different conventions for the wind speeds, and you can see from the figure the pressure-wind fits are more separated than the JTWC versions above.
[6]:
# Re-do by basin plot for IBTrACS-WMO where each basin uses the local convention
# for wind speeds
tracks = huracanpy.load(source="ibtracs", ibtracs_subset="wmo")

# Find each track at maximum intensity
# No "status" variable included with WMO subset, so include all points without nans in
# pressure and wind
tracks = tracks.isel(record=np.where(~np.isnan(tracks.slp) & ~np.isnan(tracks.wind))[0])

# Get maximum intensity (by wind)
tracks_mi = tracks.hrcn.get_apex_vals("wind")

grid, bins_pressure, bins_wind = None, None, None
for basin, _tracks in tracks_mi.groupby("basin"):
    # Unlike JTWC, this does not fail for South Atlantic
    # This is because there are some extra non-tropical cyclones not filtered out
    grid, bins_pressure, bins_wind = huracanpy.plot.pressure_wind_relation(
        _tracks.slp,
        _tracks.wind,
        wind_units="knots",
        wind_convention="10min",
        bins_pressure=bins_pressure,
        bins_wind=bins_wind,
        grid=grid,
        label=basin,
    )


# Adjust the xlimits
# This needs to be done because the fit for the South Atlantic is based on three tracks
# and pushes the xlimit to unreasonable values by default
grid.ax_joint.set_xlim(0, tracks_mi.wind.values.max())
grid.ax_joint.legend(ncol=2)
grid.fig.suptitle("Pressure-wind relation by basin. IBTrACS-WMO")
plt.tight_layout()
/home/docs/checkouts/readthedocs.org/user_builds/huracanpy/envs/v1.4.0/lib/python3.12/site-packages/huracanpy/_data/ibtracs.py:119: UserWarning: This offline function loads a light version of IBTrACS which is embedded within the package, based on a file produced manually by the developers.
 It was last updated on the 15th Nov 2024, based on the IBTrACS file at that date.
 It contains only data from 1980 up to the last year with no provisional tracks. All spur tracks were removed. Only 6-hourly time steps were kept.
  warnings.warn(
/home/docs/checkouts/readthedocs.org/user_builds/huracanpy/envs/v1.4.0/lib/python3.12/site-packages/huracanpy/_data/ibtracs.py:128: UserWarning: You are loading the IBTrACS-WMO subset. This dataset contains the positions and intensity reported by the WMO agency responsible for each basin
 Be aware of the fact that wind and pressure data is provided as they are in IBTrACS, which means in particular that wind speeds are in knots and averaged over different time periods.
 For more information, see the IBTrACS column documentation at https://www.ncei.noaa.gov/sites/default/files/2021-07/IBTrACS_v04_column_documentation.pdf
  warnings.warn(