Plotting tracks with huracanpy.plot.tracks#
[1]:
import huracanpy
[2]:
# Load the tracks
tracks = huracanpy.load(huracanpy.example_year_file)
[3]:
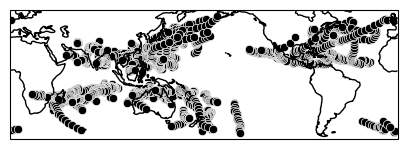
# Most basic visualisation of the dataset
huracanpy.plot.tracks(tracks.lon, tracks.lat)
/home/docs/checkouts/readthedocs.org/user_builds/huracanpy/envs/v1.4.0/lib/python3.12/site-packages/huracanpy/plot/_tracks.py:56: UserWarning: Ignoring `palette` because no `hue` variable has been assigned.
  sns.scatterplot(
[3]:
(<Figure size 1000x1000 with 1 Axes>, <GeoAxes: xlabel='lon', ylabel='lat'>)
[4]:
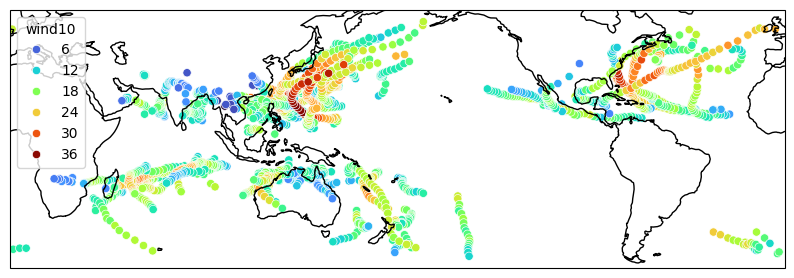
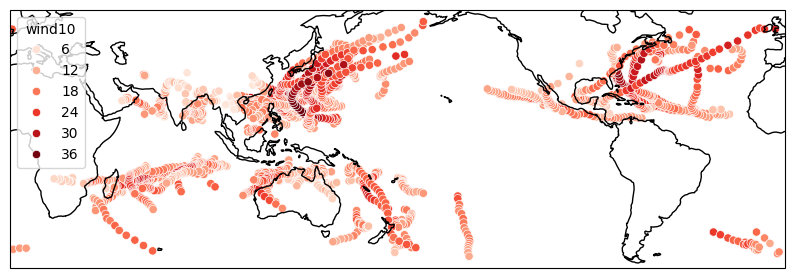
# Adding intensity coloring with `intensity_var`
huracanpy.plot.tracks(tracks.lon, tracks.lat, intensity_var=tracks.wind10)
[4]:
(<Figure size 1000x1000 with 1 Axes>, <GeoAxes: xlabel='lon', ylabel='lat'>)
[5]:
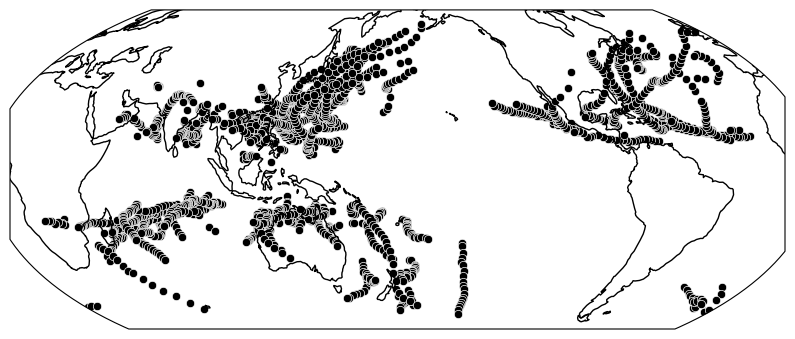
# Changing projection (ex: Mollweide, will work with any Cartopy projection)
import cartopy.crs as ccrs

huracanpy.plot.tracks(
    tracks.lon, tracks.lat, subplot_kws=dict(projection=ccrs.Mollweide(180))
)
/home/docs/checkouts/readthedocs.org/user_builds/huracanpy/envs/v1.4.0/lib/python3.12/site-packages/huracanpy/plot/_tracks.py:56: UserWarning: Ignoring `palette` because no `hue` variable has been assigned.
  sns.scatterplot(
[5]:
(<Figure size 1000x1000 with 1 Axes>, <GeoAxes: xlabel='lon', ylabel='lat'>)
[6]:
# Changing plot size
huracanpy.plot.tracks(tracks.lon, tracks.lat, fig_kws=dict(figsize=(5, 5)))
/home/docs/checkouts/readthedocs.org/user_builds/huracanpy/envs/v1.4.0/lib/python3.12/site-packages/huracanpy/plot/_tracks.py:56: UserWarning: Ignoring `palette` because no `hue` variable has been assigned.
  sns.scatterplot(
[6]:
(<Figure size 500x500 with 1 Axes>, <GeoAxes: xlabel='lon', ylabel='lat'>)
[7]:
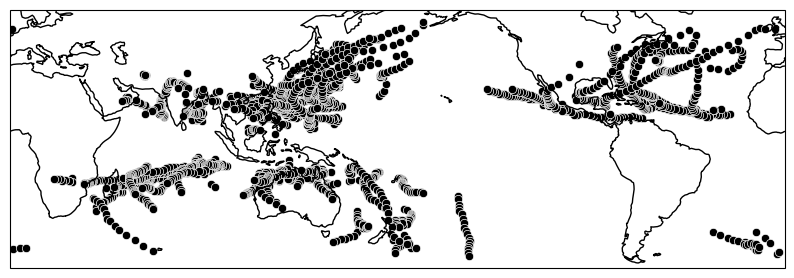
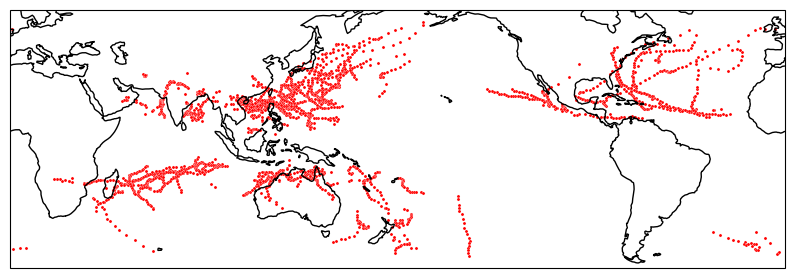
# Use `scatter_kws` to customize the plot (using option from seaborn scatterplot)
# Have large red points
huracanpy.plot.tracks(tracks.lon, tracks.lat, scatter_kws=dict(s=5, color="r"))
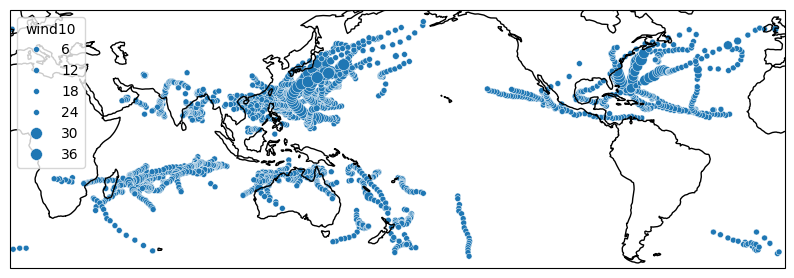
# Size per wind
huracanpy.plot.tracks(
tracks.lon, tracks.lat, scatter_kws=dict(size=tracks.wind10, size_norm=(25, 30))
)
# Change palette
huracanpy.plot.tracks(
tracks.lon,
tracks.lat,
intensity_var=tracks.wind10,
scatter_kws=dict(palette="Reds"),
)
[7]:
(<Figure size 1000x1000 with 1 Axes>, <GeoAxes: xlabel='lon', ylabel='lat'>)

[8]:
# Equivalent plots with the hrcn accessor
# Have large red points
tracks.hrcn.plot_tracks(scatter_kws=dict(s=5, color="r"))

# Size per wind
tracks.hrcn.plot_tracks(scatter_kws=dict(size=tracks.wind10, size_norm=(25, 30)))

# Change palette
tracks.hrcn.plot_tracks(intensity_var_name="wind10", scatter_kws=dict(palette="Reds"))
[8]:
(<Figure size 1000x1000 with 1 Axes>, <GeoAxes: xlabel='lon', ylabel='lat'>)