Ctrl+K
HuracanPy  documentation - Home HuracanPy  documentation - Home
  • User Guide
  • Contributor’s Guide
  • API
  • Examples
  • GitHub
  • User Guide
  • Contributor’s Guide
  • API
  • Examples
  • GitHub

Section Navigation

  • Plotting tracks with huracanpy.plot.tracks
  • Fancy line plots
  • Doughnuts
  • Track density
  • Pressure-Wind Relation
  • Additional information with the info module
  • Basic use for assessing storm climatology in a dataset
  • Beta drift
  • Interannual Variability
  • Cyclone stalling
  • Basins
  • Embedded IBTrACS Subsets
  • Examples

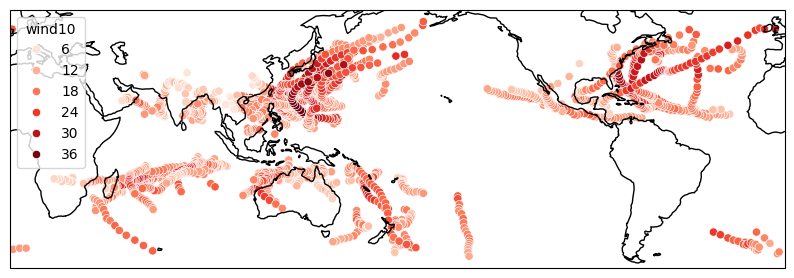
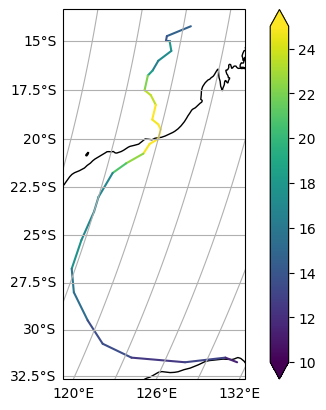
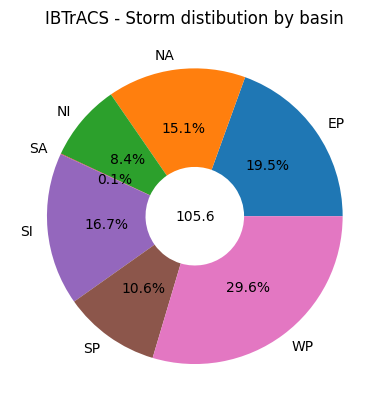
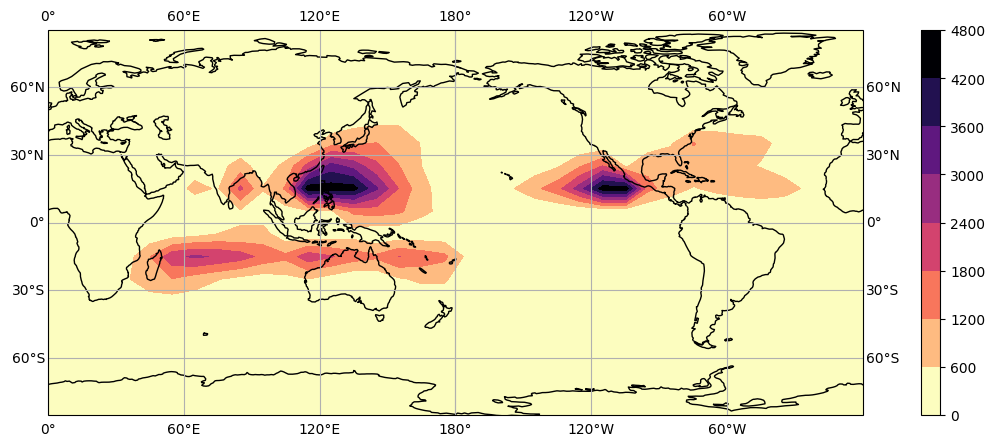
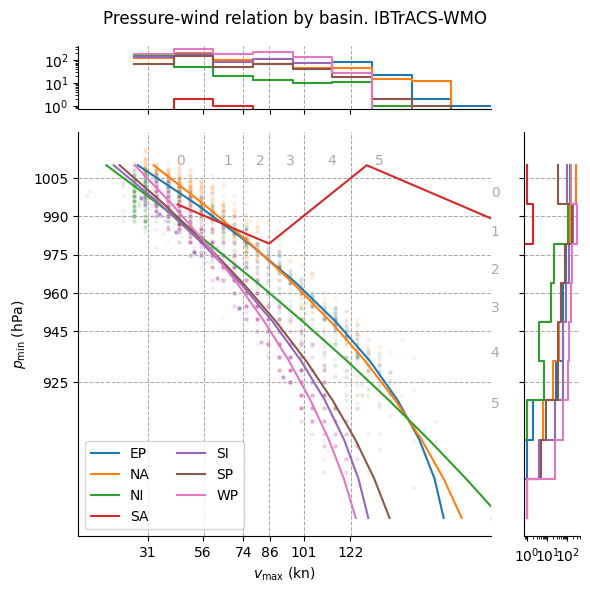
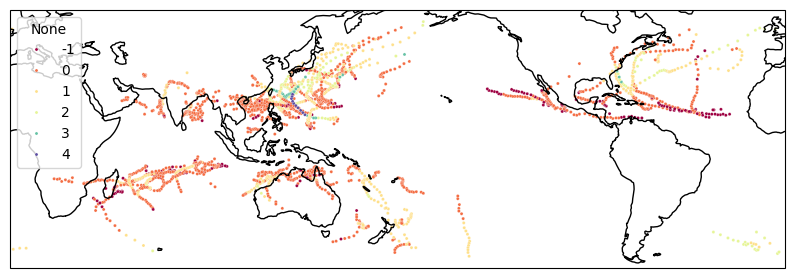
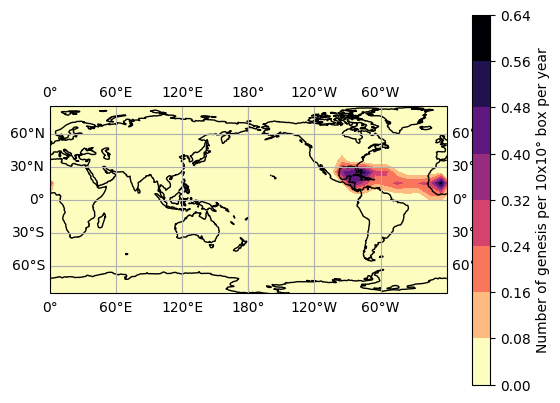
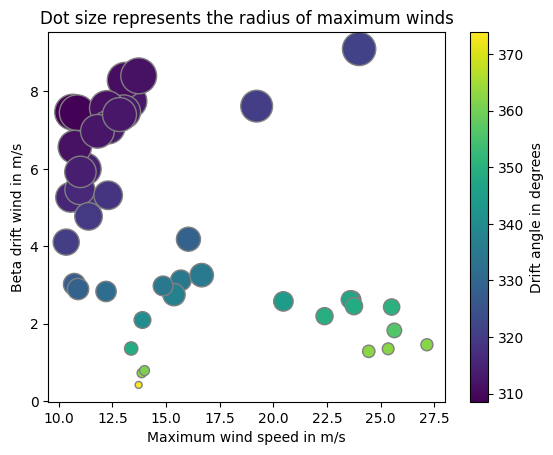
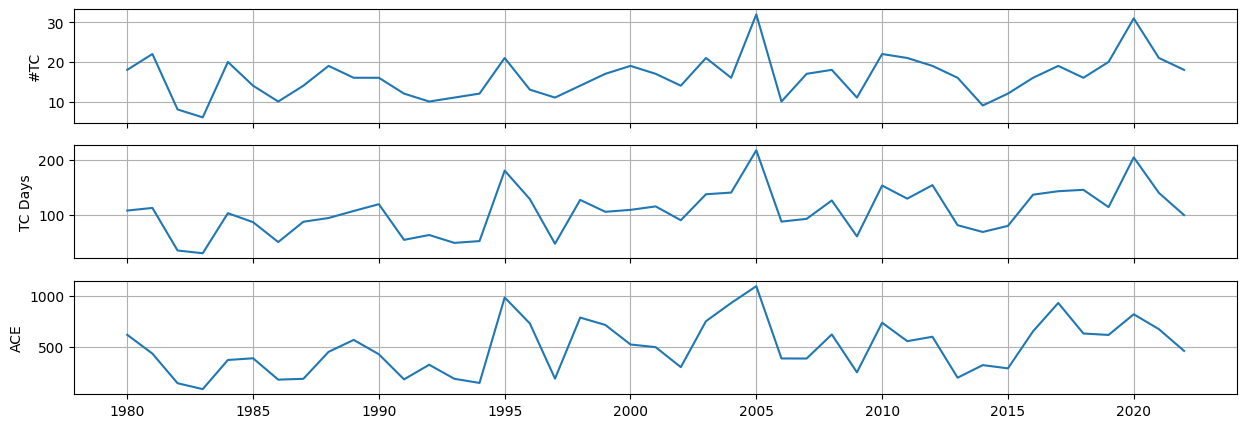
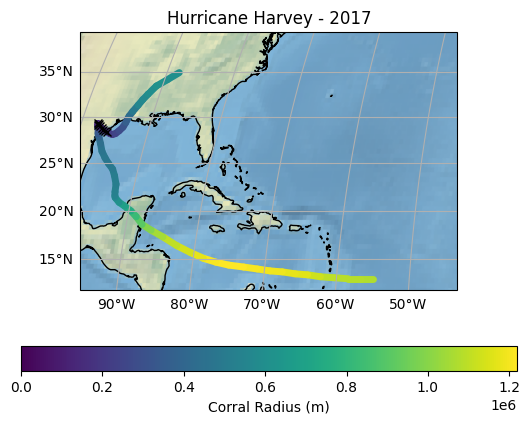
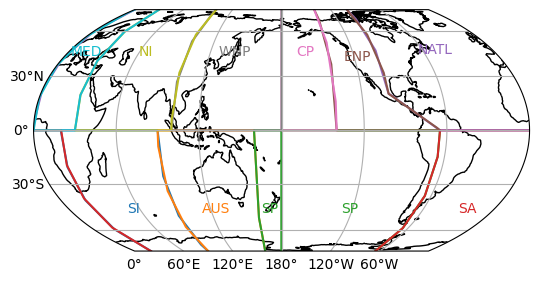
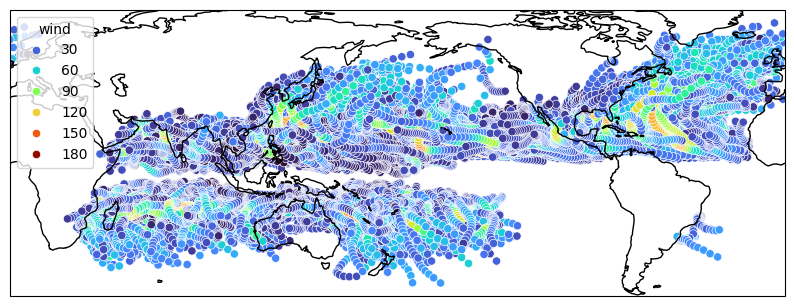
Examples#

For more in depth examples, see the example workflows in the user guide

Plots#

Plotting tracks with huracanpy.plot.tracks
Fancy line plots
Doughnuts
Track density
Pressure-Wind Relation

Diagnostics#

Additional information with the info module
Basic use for assessing storm climatology in a dataset
Beta drift
Interannual Variability
Cyclone stalling

Reference#

Basins
Embedded IBTrACS Subsets

previous

huracanpy.convert.to_geodataframe

next

Plotting tracks with huracanpy.plot.tracks

On this page
  • Plots
  • Diagnostics
  • Reference
Show Source

Created using Sphinx 8.2.3.

Built with the PyData Sphinx Theme 0.18.0.